Access the updated 2016 version of the Catalogue of Indices here.
The use of indices to measure changes in countries across different policy areas is becoming increasingly frequent. From human rights to conflict, from governance to gender, many organizations have invested in developing statistical models that derive data from multiple sources and rank countries according to their score.
The IPI’s Global Observatory provides the first list of country indices available in open-sources. It reviews thirty indices and provides a description of the methodology and results.
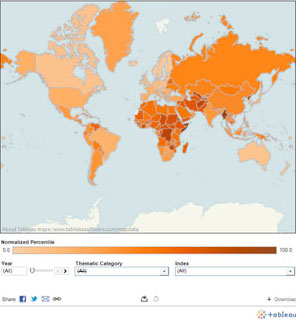
In addition, the Global Observatory has prepared an interactive world map (beta version) that shows data from all thirty different indices. Users can also see results from combined indices in different thematic categories.
Click here to view interactive map (beta version) >>
The indices are organized in six categories:
1. Conflict, Fragility, and Instability
2. Environment
3. Freedoms and Rights
4. Gender
5. Governance
6. Socio-Economics
Indices add to the world’s knowledge and provide an easy read into trends and changes that would require otherwise the analysis of a large amount of data. At the same time, indices are difficult to construct, and have little comparative power. They tend to give “black and white” pictures of countries, and some of the criteria can be quite subjective. Policy prescriptions cannot be devised on the basis of a numerical score.
1. CONFLICT, FRAGILITY, AND INSTABILITY
By The Fund for Peace
| Least Fragile |
Most Fragile |
| 1. Finland | 1. Somalia |
| 2. Sweden | 2. Democratic Republic of the Congo |
| 3. Denmark | 3. Sudan (and South Sudan) |
| 4. Switzerland | 4. Chad |
| 5. Norway | 5. Zimbabwe |
Description: The 2012 Failed State Index measures risk for instability or risk of violence in 177 states. The Failed State Index is accompanied on Foreign Policy by a map with country rankings and a photo essay series entitled “Postcards From Hell.”
Issued: Annually since 2005.
Methodology: The Fund for Peace uses its Conflict Assessment System Tool (CAST) software which scans open-source articles and reports using Boolean logic, which consists of key phrases designed to capture the twelve indicators and a number of sub-indicators covering social economic, political, and military facets of state fragility (which is reviewed through human analysis). For more on methodology, click here.
By Institute for Economics and Peace
| Most Peaceful |
Least Peaceful |
| 1. Iceland | 1. Somalia |
| 2. Denmark | 2. Afghanistan |
| 3. New Zealand | 3. Sudan |
| 4. Canada | 4. Iraq |
| 5. Japan | 5. Democratic Republic of the Congo |
Description: The 2012 Global Peace Index measures peace as the “absence of violence” and seeks to determine what cultural attributes and institutions are associated with states of peace in 158 states. The Global Peace Index is accompanied by a yearly report.
Issued: Annually since 2006.
Methodology: The Global Peace Index uses 23 qualitative and quantitative indicators, ranging from a nation’s level of military expenditure to its relations with neighboring countries and the percentage of prison population. For more on methodology, click here.
Peace and Conflict Instability Ledger
By University of Maryland
| Most Peaceful |
Most Conflicted |
| 1. Slovenia | 1. Afghanistan |
| 1. Sweden | 2. Democratic Republic of the Congo |
| 3. Finland | 3. Burundi |
| 4. Ireland | 4. Guinea-Bissau |
| 5. Netherlands | 5. Djibouti |
Description: The 2012 Peace and Conflict Instability Ledger ranks 163 countries based on their projected risk of political instability or armed conflict over a three-year period (2010-2012). It focuses in particular on violent events like war and genocide. The Peace and Conflict Instability Ledger is accompanied by the biennial Peace and Conflict Report.
Issued: Biennially since 2001.
Methodology: The Peace and Conflict Instability Ledger includes 5 indicators across social, economic, political, and security dimensions based on expert data and public statistics measuring institutional consistency (the extent to which the institutions which make up a political system are uniformly autocratic or democratic); economic openness; infant mortality rates; militarization; neighborhood security. For more on methodology, click here.
By The Economist Intelligence Unit
| Most Politically Stable |
Least Politically Stable |
| 1. Norway | 1. Zimbabwe |
| 2. Denmark | 2. Chad |
| 3. Canada | 3. Democratic Republic of the Congo |
| 4. Sweden | 4. Cambodia |
| 5. Finland | 5. Sudan |
Description: The 2010 Political Instability Index assesses 165 countries on how susceptible they are to social unrest.
Issued: in 2010, using a 2007 baseline.
Methodology: The Political Instability Index is based on four factors: (1) the level of development as measured by the infant mortality rate; (2) extreme cases of economic or political discrimination against minorities (according to assessments and codings by the Minorities at Risk Project); (3)”a bad neighborhood” (if a country has at least four neighbors that suffered violent conflicts) and; (4) regime type (intermediate regimes that are neither consolidated democracies nor autocratic regimes combined with the existence in these regimes of intense factionalism in domestic politics, as coded by the Polity Project on democracy). There are 15 indicators in all—12 for the underlying and 3 for the economic distress index. For more on methodology, click here.
By George Mason University
| Least Fragile | Most Fragile |
| N/A | 1. Somalia |
| 2. Sudan | |
| 3. Democratic Republic of the Congo | |
| 4. Afghanistan | |
| 5. Chad |
Description: The 2010 State Fragility Index rates 164 countries on state fragility and monitors change in fragility over time.
Issued: Annually since 2007. The State Fragility Index is accompanied by the 2011 Global Report.
Methodology: In the 2010 State Fragility Index, fourteen indicators are derived from expert data and public statistics measuring effectiveness and legitimacy, with four sectors each (security, political, economic, and social). Categories are ranked 0-3: 0-no fragility 1-low fragility 2-medium fragility 3-high fragility with all categories weighted equally.
Country Indicators for Foreign Policy: Failed and Fragile States
By Carleton University, The Norman Paterson School of International Affairs
| Least Fragile | Most Fragile |
| 1. Denmark | 1. Somalia |
| 2. Sweden | 2. Afghanistan |
| 3. Finland | 3. Chad |
| 4. Japan | 4. Democratic Republic of the Congo |
| 5. Switzerland | 5. Yemen |
Description: The Country Indicators for Foreign Policy examines state fragility using a combination of extensive structural data and dynamic events monitoring to prove and overall pictures of state fragility. Its 2012 report provides a global fragility ranking for 2011 for 197 countries. The Country Indicators for Foreign Policy on Failed and Fragile States is accompanied by a yearly report.
Issued: Annually since 2006.
Methodology: The Country Indicators for Foreign Policy bases its rankings on 75 indicators of state fragility and robustness, which are organized in six categories: governance, economics, security and Crime, human development, demography, and environment. For more on methodology, click here.
2. ENVIRONMENT
Environmental Performance Index
By Yale University Center for Environmental Law and Policy, Center for Internatinoal Earth Science Information Network, Columbia University in collaboration with the World Economic Forum, and the Joint Research Centre European Commission
| Best Environmental Performance | Worst Environmental Performance |
| 1. Switzerland | 1. Iraq |
| 2. Latvia | 2. Turkmenistan |
| 3. Norway | 3. Uzbekistan |
| 4. Luxembourg | 4. Kazakhstan |
| 5. Costa Rica | 5. South Africa |
Description: The 2012 Environmental Performance Index (EPI) ranks 132 countries on 25 performance indicators tracked across ten policy categories, on a national government scale, covering both environmental public health and ecosystem vitality. EPI is featured in the annual Performance Index Report.
Issued: Biennially since 2000.
Methodology: The Environmental Performance Index measures two broad components: environmental health (air pollution, water) and ecosystem vitality (climate chance, agriculture, fisheries, forestry, biodiversity and habitat, water, and air pollution). For more on methodology, click here.
By Freedom House
| Most Free | Least Free |
| N/A | 1. Equatorial Guinea |
| 2. Eritrea | |
| 3. North Korea | |
| 4. Saudi Arabia | |
| 5. Somalia | |
| 6. Sudan | |
| 7. Syria | |
| 8. Turkmenistan | |
| 9. Uzbekistan |
Description: The 2011 Freedom in the World Index measures the levels of political rights and civil liberties in 195 countries and 14 related and disputed territories. The index is featured in the yearly Freedom in the World Report.
Issued: Annually since 1972.
Methodology: The Freedom in the World Index gives countries a numerical rating of 1-7. The rating is based on survey findings carried out by regional experts and scholars. For more on the methodology, click here.
By Freedom House
| Most Press Freedom | Least Press Freedom |
| 1. Finland | 1. North Korea |
| 1. Norway | 2. Turkmenistan |
| 1. Sweden | 3. Uzbekistan |
| 1. Belgium | 4. Eritrea |
| 5. Belarus |
Description: The 2012 Press Freedom Survey measures the state of global press freedoms in 197 countries. The Press Freedom Survey is featured in the annual Freedom of the Press country reports.
Issued: Annually since 1980.
Methodology: The Press Freedom Survey rate countries press freedom in three clusters: “Legal Environment” (0-30 points), “Political Influences” (40 points), and “Economic Pressures” (30 points). Countries are ranked as 0-30 “Free”, 31-60 “Partly Free”, 61-100 “Not Free.” For more on methodology, click here.
By Reporters without Borders
| Most Press Freedom | Least Press Freedom |
| 1. Finland | 1. Eritrea |
| 2. Norway | 2. North Korea |
| 3. Estonia | 3. Turkmenistan |
| 4. Netherlands | 4. Syria |
| 5. Austria | 5. Iran |
Description: The 2012 Worldwide Press Freedom Index measures the state of media freedom in 179 countries to reflect the degree of freedom that citizens, journalists, and news media enjoy in each country. The Worldwide Press Freedom Index is featured in the annual Press Freedom Index Report.
Issued: Annually since 2002.
Methodology: Based on a questionnaire sent to partner organizations and 130 correspondents (18 freedom of expression groups in all five continents), and to journalists, researchers, jurists, and human rights activists based on 44 criteria related to press freedom. For more on the methodology, click here.
Cingranelli-Richards (CIRI) Human Rights Database
By David L. Cingranelli (Binghamton University, SUNY and David L. Richards, University of Memphis)
| Best Human Rights Record | Worst Human Rights Record |
| 1. Denmark | 1. Burma |
| 2. Iceland | 2. Eritrea |
| 3. Austria | 3. Iran |
| 4. New Zealand | 4. China |
| 5. Norway | 5. North Korea |
Description: CIRI measures governments’ overall level of respect for human rights in a particular year in 195 countries. CIRI does not measure overall human rights conditions (which may be affected by non-state actors).
Issued: Annually from 1981 to 2010.
Methodology: CIRI measures a range of rights, including physical integrity rights (such as the right not to be tortured, summarily executed, disappeared, or imprisoned for political beliefs); civil liberties (such as free speech, freedom of association and assembly, freedom of movement); workers’ rights; and rights of women to equal treatment politically, economically, and socially.
Economic Freedom in the World Index
By The Fraser Institute
| Most Economic Freedom | Least Economic Freedom |
| 1. Hong Kong | 1. Zimbabwe |
| 2. Singapore | 2. Myanmar |
| 3. New Zealand | 3. Venezuela |
| 4. Switzerland | 4. Angola |
| 5. Australia | 5. Democratic Republic of the Congo |
Description: The Economic Freedom in the World Index measures the degree to which the policies and institutions of 144 countries are supportive of economic freedom. Economic freedom includes personal choice, voluntary exchange, freedom to compete, and security of privately-owned property. The index is featured in the annual Economic Freedom in the World Annual Report.
Issued: Annually since 1997.
Methodology: The Economic Freedom in the World Index is based on forty-two data points used to construct a summary index to measure the degree of freedom based on five broad areas: (1) size of government: expenditures, taxes, and enterprises; (2) legal structure and security of property rights; (3) access to sound money; (4) freedom to trade internationally (5) regulations of credit, labor, and business.
By The Heritage Foundation and The Wall Street Journal
| Most Economic Freedom | Least Economic Freedom |
| 1. Hong Kong | 1. North Korea |
| 2. Singapore | 2. Zimbabwe |
| 3. Australia | 3. Cuba |
| 4. New Zealand | 4. Libya |
| 5. Switzerland | 5. Eritrea |
Description: The 2012 Index of Economic Freedom examines economic freedom in 184 countries (economic freedom refers to property ownership, fully realized freedoms of movement for labor, capital and goods, and an absolute absence of coercion or constraint of economic liberty beyond the extent necessary for citizens to protect and maintain liberty itself). The Index of Economic Freedom is featured in the annual Index of Economic Freedom Reports.
Issued: Annually since 1995.
Methodology: The Index of Economic Freedom measures ten components of economic freedom, assigning a grade in each using a scale from 0 to 100, where 100 represents the maximum freedom. The 10 economic freedoms are grouped into four broad categories or pillars of economic freedom: (1) rule of law; (2) limit government; (3) regulator efficiency; and (4) open markets. For more on the methodology, click here.
By The United Nations Development Programme (UNDP)
| Highest Human Development | Lowest Human Development |
| 1. Norway | 1. Democratic Republic of the Congo |
| 2. Australia | 2. Niger |
| 3. Netherlands | 3. Burundi |
| 4. United States | 4. Mozambique |
| 5. New Zealand | 5. Chad |
Description: The 2011 Gender Inequality Index provides insights into gender disparities in health, empowerment and labor market in 187 countries. It can be useful to help governments and others better understand the gaps between women and men. The Gender Inequality Index is featured in the annual Human Development Report.
Issued: Annually since 2010 (replaced the Gender Related Development Index and Gender Empowerment Measure).
Methodology: The Gender Inequality Index is a composite index based on the following dimensions measuring inequalities between women and men: reproductive health, empowerment and the labor market. The measure varies between 0 (when women and men fare equally) and 1 (When women and men fare poorly compared to the other in all dimensions). For more on the methodology, click here.
By The World Economic Forum
| Smallest Gender Gap | Largest Gender Gap |
| 1. Iceland | 1. Yemen |
| 2. Norway | 2. Chad |
| 3. Finland | 3. Pakistan |
| 4. Sweden | 4. Mali |
| 5. Ireland | 5. Saudi Arabia |
Description: The Global Gender Gap Index benchmarks national gender gaps on economic, political, educational, and health based criteria and provides country rankings. 135 countries are ranked between 0 (inequality) and 1 (equality). The Global Gender Gap Index in the annual Global Gender Gap Report.
Issued: Annually since 2006.
Methodology: The Global Gender Gap Index measures the gap between men and women using four main categories: (1) economic participation; (2) educational attainment; (3) health and survival; (4) and political empowerment. The GGI combines quantitative and qualitative measures from the executive survey of the World Economic Forum, a survey of 9,000 business leaders. For more on the methodology click here.
By Transparency International
| Least Corrupt | Most Corrupt |
| 1. New Zealand | 1. Somalia |
| 2. Denmark | 2. North Korea |
| 3. Finland | 3. Myanmar |
| 4. Sweden | 4. Afghanistan |
| 5. Singapore | 5. Uzbekistan |
Description: The Corruption Perceptions Index measures the levels of perceived corruption in countries around the world. The Corruption Perceptions Index is accompanied by the annual report.
Issued: Annually since 2001.
Methodology: The Corruption Perceptions Index measures the perceived levels of corruption as determined by expert assessments and opinion surveys. Evaluation of the extent of corruption in countries/territories is done by two groups: country experts, both residents and non-residents, and business leaders. For more on methodology click here (see “What are the date sources for the CPI?”).
By The Economist Intelligence Unit
| Most Democratic | Least Democratic |
| 1. Norway | 1. North Korea |
| 2. Iceland | 2. Chad |
| 3. Denmark | 3. Turkmenistan |
| 4. Sweden | 4. Uzbekistan |
| 5. New Zealand | 5. Myanmar |
Description: The 2011 Democracy Index measures the state of democracy worldwide for 167 independent states. The Democracy Index is accompanied by the annual Democracy Index Report.
Issued: Annually since 2007.
Methodology: The Democracy Index is based on a weighted average of public opinion surveys and expert assessment based on the answers of 60 questions grouped ito five categories : (1) electoral process and pluralism; (2) civil liberties; (3) the functioning of government; (4) political participation; and (5) political culture. Some answers are provided by public-opinion surveys from the respective countries.
The World Bank Governance Indicators
Description: This index by the World Bank measures the level of governance in 200 countries–governance meaning the process by which governments are selected, monitored and replaced; the capacity of the government to effectively formulate and implement sound policies; and the respect of citizens and the state for the institutions that govern economic and social interactions among them.
Issued: Annually since 1996.
Methodology: The aggregate indicators combine the views of a large number of enterprise, citizen and expert survey respondents in industrial and developing countries. The index consists of six composite indicators of broad dimensions of governance: (1) Voice and Accountability; (2) Political Stability and Absence of Violence; (3) Government Effectiveness; (4)Regulatory Quality; (5) Rule of Law; (6) Control of Corruption. Countries are given a percentile rank on each governance indicator indicating the percentage of countries that rank below the selected country. For more on methodology, click here.
Bertelsmann Transformation Index (Status Index)
By Bertelsmann Stiftung
| Best Status | Worst Status |
| 1. Czech Republic | 1. Somalia |
| 2. Taiwan | 2. Myanmar |
| 3. Slovenia | 3. Eritrea |
| 4. Uruguay | 4. North Korea |
| 5. Estonia | 5. Afghanistan |
Bertelsmann Transformation Index (Management Index)
By Bertelsmann Stiftung
| Best Management | Worst Management |
| 1. Taiwan | 1. North Korea |
| 2. Uruguay | 2. Somalia |
| 3. Estonia | 3. Myanmar |
| 4. Brazil | 4. Eritrea |
| 5. Chile | 5. Cote d’Ivoire |
Description: The Bertelsmann Transformation Index examinesanalyzes quality of democracy and the market economy (Status Index) and political management in 128 developing and transition countries (Management) Index. Analysis of the Bertelsmann Transformation Index is included in country reports.
Issued: Biennially since 2001.
Methodology: The Bertelsmann Transfomation Index uses two out of forty-nine questions from the country assessments, which employ one primary researcher per country, one peer reviewer and two calibration rounds by regional and global coordinators. The BTI publishes two rankings, the Status Index and the Management Index, both of which are based on in-depth assessments. For more on methodology, click here.
Gallup Global Wellbeing (thriving) Index
By: Gallup
(This Index is updated continuously and does not rank countries.)
Description: The Gallup Global Wellbeing Index measures life satisfaction at the country level in over 150 countries.
Issued: Gallup surveys have been regularly updated since 2006.
Methodology: The Gallup Global Wellbeing Index is based on telephone and face-to-face interviews in which interviewers were asked questions related to their wellbeing (feeling well-rested, being treated with respect, smiling/laughter, learning/interest, enjoyment, physical pain, worry, sadness, stress, and anger) on a scale from 0-10. For more on methodology, click here.
By International Food Policy Research Institute, Concern Worldwide, Welthungerhilfe
| Least Susceptible to Hunger | Most Susceptible to Hunger |
| N/A | 1. Gabon |
| 2. Mauritius | |
| 3. Paraguay | |
| 4. China | |
| 4. El Salvador | |
| 4. Kyrgyz Republic |
Description: The Global Hunger Index measures and tracks hunger globally and by country and region for 81 countries. The Global Hunger Index is featured in the annual Global Hunger Index report.
Issued: Annually since 2006.
Methodology: The Global Hunger Index is a composite index using a number of different indicators that fall into three broad categories, 1. Undernourishment 2. Child underweight 3. Child mortality. The GHI ranks countries on a 100 point scale (0 is the best, ‘no hunger’, 100 the worst). For more on the methodology, click here.
By The United Nations Development Programme
| Most Developed | Least Developed |
| 1. Norway | 1. Democratic Republic of the Congo |
| 2. Australia | 2. Niger |
| 3. Netherlands | 3. Burundi |
| 4. United States | 4. Mozambique |
| 5. New Zealand | 5. Chad |
Description: The 2011 Human Development Index measures progress since 1980 in the three basic dimensions: health (life expectancy at birth), knowledge (mean years of schooling) and income (GNI per capita) in 187 countries. The index is intended to assess development beyond just economic growth by looking also at the people and their capabilities. HDI is featured in the annual Human Development Report.
Issued: Annually since 1990.
Methodology: HDI measures development by combining indicators of life expectancy, educational attainment and income into a composite index. For more on the methodology, click here.
Multidimensional Poverty Index
By The Oxford Poverty and Human Development Initiative (OPHI) and UNDP Human Development Report Office
| Least Impoverished Developing Nations | Most Impoverished Developing Nations |
| 1. Slovakia | 1. Niger |
| 2. Slovenia | 2. Ethiopia |
| 3. Belarus | 3. Mali |
| 4. United Arab Emirates | 4. Burkina Faso |
| 5. Kazakhstan | 5. Burundi |
Description: The 2011 Multidimensional Poverty Index measures acute poverty by giving a “multidimensional” picture of people living in poverty in 109 developing nations. The MPI has supplanted the Human Poverty Index, which had been included in the annual Human Development Reports since 1997. The Multidimensional Poverty Index is featured in the annual Human Development Report.
Issued: Annually since 2011.
Methodology: The Multidimensional Poverty Index examines information on household members. The index examines health, education, and living standards using ten indicators across 109 countries (2011). For more on the methodology, click here.
World Bank Ease of Doing Business Indicators
By World Bank International Bank for Reconstruction and Development
| Most Conducive to Businesses |
Least Conducive to Businesses |
| 1. Singapore | 1. Chad |
| 2. Hong Kong | 2. Central African Republic |
| 3. New Zealand | 3. Republic of the Congo |
| 4. United States | 4. Eritrea |
| 5. Denmark | 5. Guinea |
Description: The World Bank Ease of Doing Business Indicators assess whether the regulatory environment in 193 countries are conducive to the starting and operation of a local firm. The World Bank Ease of Doing Business Indicators is accompanied by an annual Doing Business report.
Issued: Annually.
Methodology: The World Bank Ease of Doing Business Indicators averages the percentile rankings of ten indicators that measuring the climate for doing businesses in economies, such as starting a business, trading across borders, enforcing contracts, accessing electricity, etc.. For more on methodology, click here.
By World Economic Forum
| Most Competitive | Least Competitive |
| 1. Switzerland | 1. Burundi |
| 2. Singapore | 2. Sierra Leone |
| 3. Finland | 3. Haiti |
| 4. Sweden | 4. Guinea |
| 5. Netherlands | 5. Yemen |
Description: The Global Competitiveness Index measures the business operating environment and microeconomic and macroeconomic levels of competitiveness of over 144 economies worldwide (competitiveness defined as the institutions, policies, and factors that determine the productivity of a country). The Global Competitiveness Index is featured in the annual Global Competitiveness Report.
Issued: Annually since 2008.
Methodology: The Global Competitiveness Index is a weighted average of what it refers to as “pillars” of competitiveness, including institutions, infrastructure, higher education and training, good market efficiency, etc.
Impunity Index on the Murder of Journalists
By The Committee to Protect Journalists
| Least Impunity on Murder of Journalists | Most Impunity on Murder of Journalists |
| N/A | 1. Iraq |
| 2. Somalia | |
| 3. Philippines | |
| 4. Sri Lanka | |
| 5. Colombia |
Description: The Impunity Index on the Murder of Journalists identifies countries where journalists are murdered regularly, and where governments fail to solve the crimes. Impunity for threats and harassment/ killing of journalist is seen as a key indicator of press freedom and freedom of expression.
Issued: First issued in 2011, covering previous ten years.
Methodology: The Impunity Index on the Murder of Journalists identifies the number of unsolved journalist murders as a percentage of each country’s population. Only the thirteen nations with five or more unsolved cases are included in this index. Cases are considered unsolved when no convictions have been obtained. For more about the methodology, click here.
By The World Bank
| Developing Country Most Able to Reduce Poverty |
Developing Country Least Able to Reduce Poverty |
| 1. Georgia | 1. Eritrea |
| 2. Samoa | 2. Zimbabwe |
| 3. Armenia | 3. Sudan |
| 4. Cape VErde | 4. Chad |
| 5. Ghana | 5. Comoros |
Description: CPIA/ IDA Resource Allocation Index assesses developing countries’ policies to reduce poverty, promote sustainable growth, and effectively use development assistance to help guide the allocation of IDA lending resources.
Issued: Annually since 2005.
Methodology: The CPIA/ IDA Resource Allocation Index is based on the results of the CPIA, which are grouped into four clusters: (1) economic management; (2) structural policies; (3) policies for social inclusion and equity; and (4) public sector management institutions. In each, countries are rated from 1 (low)-6 (high). Ratings are made by expert survey conducted by UN staff reflecting a variety of indicators, observations and judgments. For more on methodology, click here.